MISSION BRIEF
From public data to an interactive analytics experience.
An evidence-aware approach to nutritional data normalization, interactive visualization, and decision support.
Tools: Next.js · React · TypeScript · Apache ECharts · Sanity CMS · GitHub · Vercel
THE DATA PRODUCT
Explore the published interactive dashboard.
Open the companion inquiry to explore the visualizations and analytical findings. The technical implementation is documented below.
Open the interactive dashboard →TECHNICAL FIELD LOG
Architecture, methodology, and implementation.
Building an Interactive Dog Food Nutrition Comparison Dashboard
An evidence-aware approach to nutritional data normalization, interactive visualization, and decision support.
Project Overview
Project: Dog Food Nutrition Comparison Dashboard
Products compared: Inukshuk 26/16, Eukanuba Adult Medium Breed Dry Dog Food, and Purina Pro Plan Complete Essentials Chicken & Rice
Technology stack: Next.js, React, TypeScript, Apache ECharts, Sanity CMS, GitHub, and Vercel
Business and Analytical Challenge
Comparing dry dog foods is more complicated than reading the percentages printed on their packaging.
Manufacturers report nutritional information using different measurement bases and levels of precision. Some values are guaranteed minimums or maximums, while others represent reported nutritional concentrations. Additionally, nutritional information may be incomplete or unavailable for certain products.
These differences can make direct comparisons misleading.
This project addresses three questions:
- How can nutritional information from different manufacturers be standardized for meaningful comparison?
- How can an interactive dashboard communicate nutritional differences without concealing missing data or measurement uncertainty?
- How can nutritional characteristics, feeding energy, and product pricing be presented together to support informed comparisons?
Project Objective
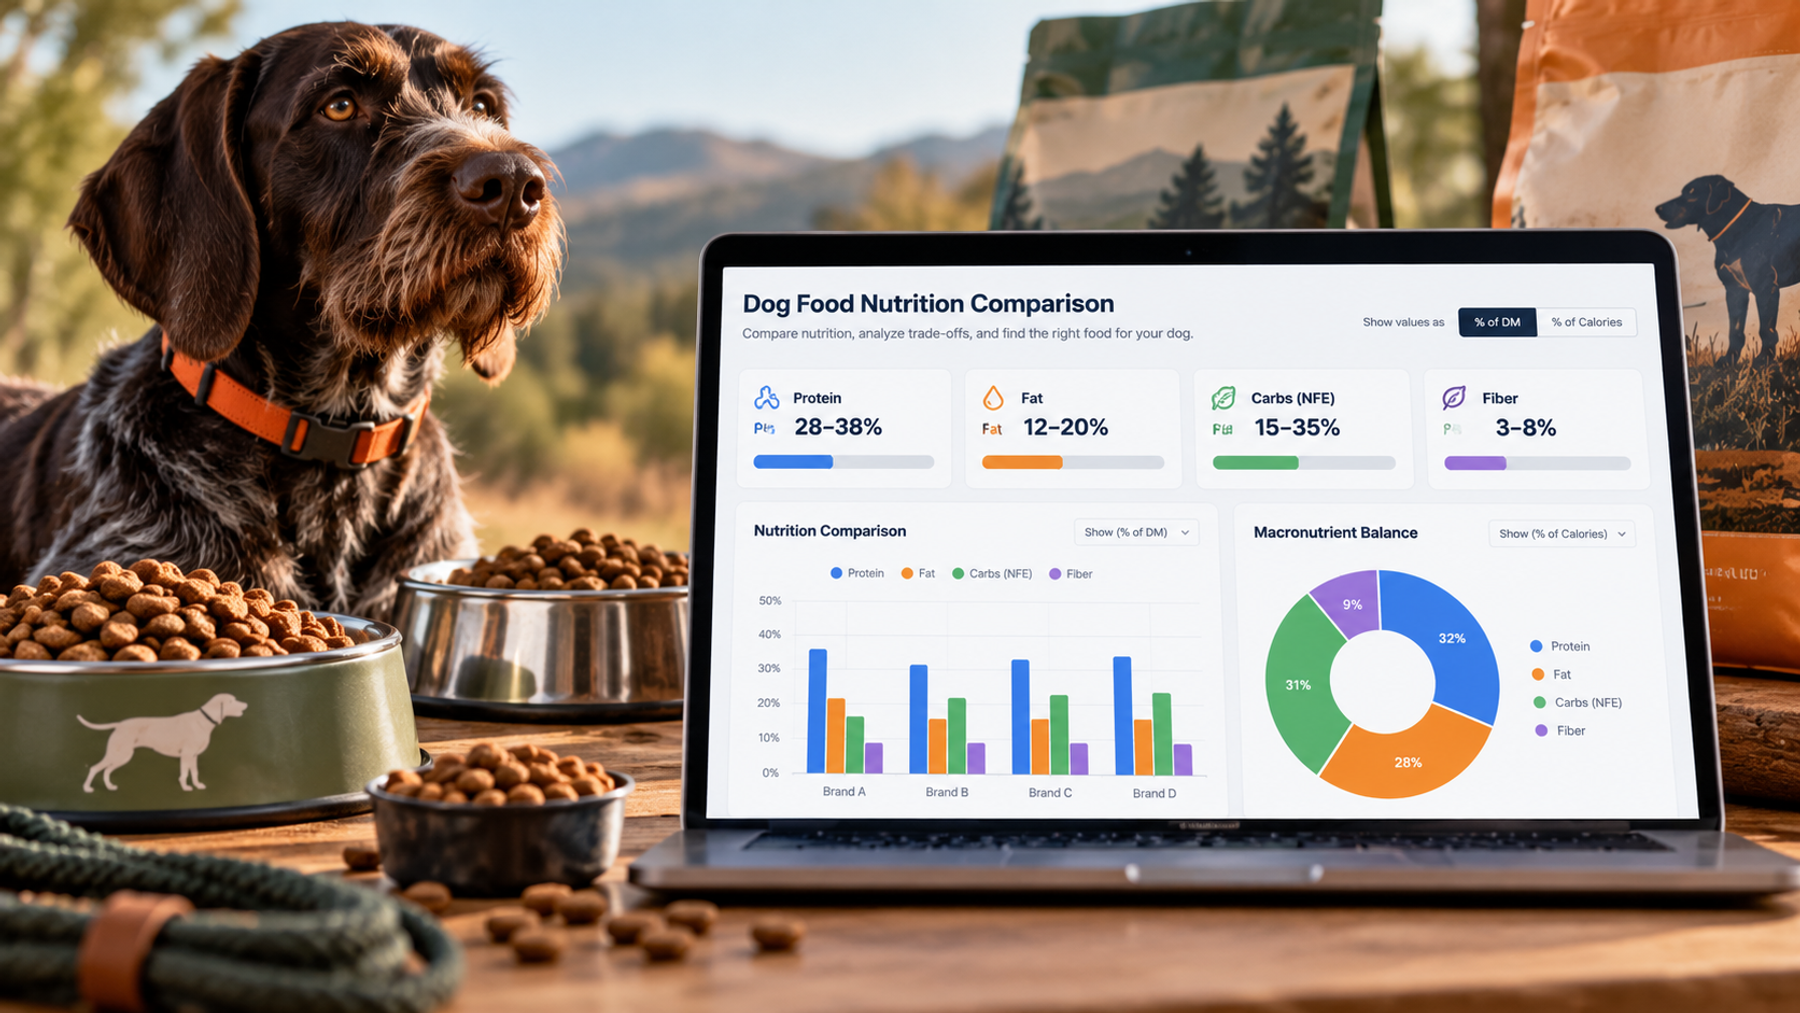
I developed an interactive dashboard that allows users to compare the nutritional composition, energy density, and pricing of three commercially available dry dog foods.
The application standardizes nutrient concentrations to a dry-matter basis, distinguishes reported values from guaranteed-analysis bounds, and provides reference values from AAFCO and published clinical nutrition guidance.
Interactive visualizations allow users to explore individual nutrients, compare energy content, examine pricing, and assess the completeness of available nutritional data.
The solution is designed to support transparent, exploratory comparisons rather than provide individualized veterinary dietary recommendations.
Technical Architecture
The Dog Food Nutrition Comparison Dashboard was developed as an interactive analytics application using Next.js, React, TypeScript, and Apache ECharts.
The architecture separates nutritional data definitions, measurement normalization, reference standards, visualization logic, and editorial content. This separation makes the analytical calculations easier to review and allows nutritional data and reference values to be maintained independently of the visualization interface.
Application Framework
Next.js provides the application framework, while React manages the dashboard's interactive controls and visualization state.
TypeScript defines the structures used to represent dog-food products, nutrient measurements, measurement bases, and supporting nutritional information.
Apache ECharts provides the interactive charting functionality, enabling users to compare products across selected nutritional and pricing measures.
Nutritional Data Architecture
The dashboard maintains structured nutritional information for three dry dog foods:
- Inukshuk 26/16
- Eukanuba Adult Medium Breed Dry Dog Food
- Purina Pro Plan Complete Essentials Chicken & Rice
Each product's data includes available nutrient concentrations, moisture information, and additional nutritional measurements.
Nutrient records distinguish three measurement types:
- Reported: A stated nutritional concentration.
- Minimum: A guaranteed lower bound.
- Maximum: A guaranteed upper bound.
The data model also records whether a measurement is expressed on an as-fed or dry-matter basis.
These distinctions are essential because a guaranteed minimum or maximum is not equivalent to a measured nutritional concentration.
Measurement Normalization
The application uses dry-matter normalization to support comparisons between foods with different moisture contents.
For an as-fed nutrient concentration, the conversion is:
Dry-Matter Nutrient (%) = As-Fed Nutrient (%) ÷ (100 − Moisture %) × 100
Values already reported on a dry-matter basis are retained without an additional conversion.
When guaranteed-analysis measurements are converted, the application preserves their minimum or maximum classification rather than treating the converted result as an exact measurement.
This approach makes the measurement basis consistent while retaining information about the original data's precision and limitations.
Reference Data Architecture
Nutritional reference values are maintained separately from manufacturer-reported product information.
The dashboard supports comparisons against:
- AAFCO nutritional reference values.
- Clinical nutrition guidance for dogs with normal body condition.
- Clinical nutrition guidance for inactive or obesity-prone dogs.
Separating these reference datasets from product measurements helps prevent reference values from being confused with actual nutrient concentrations.
The clinical reference profiles provide comparative context rather than individualized feeding recommendations.
Visualization Architecture
The primary visualization is implemented as a React component using Apache ECharts.
The dashboard supports interactive selection of nutrients and comparison measures, including:
- Protein, fat, fiber, calcium, phosphorus, omega-3, and omega-6.
- Product pricing.
- Metabolizable energy expressed as calories per cup.
Users can switch between available nutritional reference profiles and examine the underlying product values.
The interface also communicates nutrient data coverage, distinguishing reported values, guaranteed-analysis bounds, and unavailable measurements.
This design allows the visualization to represent incomplete data explicitly rather than silently omitting products or implying unsupported precision.
Content Management and Deployment
Sanity CMS manages the editorial content associated with the published inquiry and its companion case study.
GitHub provides source control, while Vercel hosts the production Next.js application.
The development workflow includes local implementation, TypeScript validation, interactive browser testing, Git commits, production deployment, and verification of the published dashboard.
This workflow supports incremental development while preserving the ability to validate analytical behavior before releasing changes to the public website.
Data Preparation and Analytical Methodology
Product Selection Rationale
The inspiration for this project came from observing how frequently certain dog-food brands were recommended and promoted by influencers and content creators within the upland hunting community.
Inukshuk, Eukanuba, and Purina Pro Plan appeared repeatedly in the social media content I encountered. However, these recommendations were often presented through personal experiences, testimonials, and anecdotal observations rather than standardized nutritional comparisons.
I wanted to investigate a more objective question: How do these frequently promoted dog foods actually compare when evaluated using nutritional data and published scientific references?
I selected Inukshuk 26/16, Eukanuba Adult Medium Breed Dry Dog Food, and Purina Pro Plan Complete Essentials Chicken & Rice as three products to investigate.
Rather than accepting brand popularity or individual endorsements as evidence of nutritional superiority, I developed a comparison framework based on:
- Nutritional information obtained from manufacturers and available product documentation.
- Standardized dry-matter nutrient concentrations.
- AAFCO nutritional reference values.
- Published clinical nutrition guidance.
- Energy density and product pricing.
- Transparency regarding missing measurements and limitations in the available evidence.
The objective was not to prove or disprove any particular influencer's recommendation. It was to establish a transparent, evidence-based method for comparing products that were already receiving attention within the upland hunting community.
Selection limitation: These products were chosen because of their visibility in the social media content I encountered, not through a systematic market survey or random sampling. Their inclusion should not be interpreted as evidence that they are the most popular, highest-performing, or most nutritionally appropriate foods for upland hunting dogs.
The resulting dashboard demonstrates how an observation drawn from social media can be transformed into a structured analytical investigation grounded in available nutritional data and research.
Data Sources
The dashboard combines nutritional information from three commercial dry dog foods with published nutritional reference values.
The products included are:
- Inukshuk 26/16: Nutritional information supplied directly by the manufacturer, including nutrient concentrations, minerals, vitamins, and metabolizable energy.
- Eukanuba Adult Medium Breed Dry Dog Food: Manufacturer-provided nutritional information, including nutrient concentrations and metabolizable energy.
- Purina Pro Plan Complete Essentials Shredded Blend Chicken & Rice: Nutritional information supplied directly by Nestlé Purina PetCare on October 23, 2026, including protein, fat, fiber, moisture, ash, calculated carbohydrates, omega fatty acids, calcium, phosphorus, and calories per cup.
Manufacturer Data Requests and Responsiveness
To obtain more complete nutritional information than was readily available through standard product labeling, I contacted the manufacturers directly.
Both Inukshuk and Eukanuba responded within 24 hours of my initial inquiries and provided nutritional information that could be incorporated into the dashboard.
Purina had not responded as of October 20, 2026. Consequently, the initial version of the dashboard used values from a product-specific nutritional information screenshot believed to correspond to the selected formula.
On October 23, 2026, Nestlé Purina PetCare responded with nutritional information explicitly identifying the requested Complete Essentials Shredded Blend Chicken & Rice product.
This response allowed me to replace the earlier source values, fill previously unavailable measurements, and document the data using a direct manufacturer response.
The analysis also incorporates AAFCO nutritional reference values and clinical nutrition guidance from Small Animal Clinical Nutrition, Chapter 13.
These reference datasets provide context for interpreting nutritional concentrations. They are maintained separately from the product measurements.
Data Preparation and Standardization
The central analytical challenge was establishing a consistent basis for comparing products whose nutritional information was reported using different conventions.
The dashboard standardizes nutrient concentrations to a dry-matter basis.
For nutrients reported on an as-fed basis, the conversion is:
Dry-Matter Nutrient (%) = As-Fed Nutrient (%) ÷ (100 − Moisture %) × 100
For example, a food containing 26% protein as fed and 10% moisture has a calculated dry-matter protein concentration of approximately 28.89%.
Measurements already supplied on a dry-matter basis do not undergo an additional conversion.
This standardization reduces the effect of differences in moisture content when comparing nutritional concentrations.
However, dry-matter normalization does not make guaranteed-analysis bounds equivalent to measured or typical nutrient concentrations.
Measurement Classification and Data Quality
The application distinguishes three categories of nutritional measurements:
Reported values: Nutrient concentrations stated in the available product information.
Guaranteed minimums or maximums: Regulatory-style bounds that establish a lower or upper limit rather than an exact concentration.
Unavailable values: Nutrients for which the available source material does not provide a usable measurement.
This classification is preserved throughout the comparison process.
For example, a guaranteed protein minimum should not be interpreted as the product's exact protein concentration. Similarly, a guaranteed fiber maximum does not establish the amount of fiber typically present.
Where measurements are unavailable, the dashboard communicates the missing information instead of substituting estimates.
Improving Data Quality Through Manufacturer Verification
An important part of developing this dashboard was recognizing that publicly available nutritional information does not always provide a complete or directly comparable picture.
Initially, some nutritional values came from published product information, including guaranteed analyses and manufacturer-provided averages. These sources can differ in their reporting basis, level of detail, and certainty about the exact product formulation.
To improve the quality of the underlying dataset, I contacted the manufacturers directly to request more complete nutritional information.
On October 23, 2026, Nestlé Purina PetCare provided additional nutritional data for Purina Pro Plan Complete Essentials Shredded Blend Chicken & Rice.
The response included:
- Crude protein: 27.0% as fed.
- Crude fat: 17.6% as fed.
- Crude fiber: 1.7% as fed.
- Moisture: 8.7%.
- Ash: 7.3% as fed.
- Carbohydrates, calculated as nitrogen-free extract: 37.7% as fed.
- Omega-3 fatty acids: 0.02% as fed.
- Omega-6 fatty acids: 2.18% as fed.
- Calcium: 1.35% as fed.
- Phosphorus: 1.02% as fed.
- Metabolizable energy: 369 calories per cup.
The new information provided a more complete nutritional profile and resolved two missing measurements in the original seven-nutrient comparison: omega-3 and omega-6 fatty acids.
Turning Manufacturer Data Into Comparable Measurements
Because Purina supplied nutrient percentages on an as-fed basis, I converted the concentrations to dry matter using the reported moisture content of 8.7%.
The calculated dry-matter values include:
- Protein: approximately 29.57%.
- Fat: approximately 19.28%.
- Fiber: approximately 1.86%.
- Calcium: approximately 1.48%.
- Phosphorus: approximately 1.12%.
- Omega-3: approximately 0.02%.
- Omega-6: approximately 2.39%.
The supporting dataset also includes calculated dry-matter carbohydrate and ash concentrations of approximately 41.29% and 8.00%, respectively.
These additional measurements expand the available nutritional information, although carbohydrates and ash are not among the dashboard's seven primary interactive nutrient comparisons.
The energy-density record was also updated from the previously used 387 calories per cup to Purina's directly reported value of 369 calories per cup.
The original guaranteed-analysis values were preserved separately from the newly reported nutrient concentrations.
What Changed in the Dataset
The manufacturer verification process produced several improvements:
- Replaced earlier Purina nutrient values with product-specific information supplied directly by the manufacturer.
- Added reported omega-3 and omega-6 concentrations.
- Incorporated carbohydrate and ash information into the supporting dataset.
- Recalculated nutrient concentrations on a consistent dry-matter basis.
- Updated the reported energy density to 369 calories per cup.
- Preserved guaranteed-analysis bounds as separate measurement records.
- Updated source documentation to identify the manufacturer response and its date.
These changes improved both the completeness and traceability of the Purina record.
Why Manufacturer Verification Matters
A dashboard can be technically functional while still relying on incomplete or uncertain source information.
Obtaining better evidence did not require rebuilding the visualization. It required updating the underlying dataset, applying the established normalization method, preserving measurement classifications, and documenting the source.
The experience reinforced an important principle of analytics engineering: data quality is not a one-time preprocessing activity. It is an ongoing process of improving evidence, revisiting assumptions, and maintaining analytical outputs as new information becomes available.
The result is a more complete and transparent comparison tool.
Nutrient Coverage Assessment
The dashboard tracks seven primary nutritional measures:
- Protein.
- Fat.
- Crude fiber.
- Calcium.
- Phosphorus.
- Omega-3 fatty acids.
- Omega-6 fatty acids.
Each product's data coverage is classified according to whether a value is reported, represented by a guaranteed-analysis bound, or unavailable.
Following the October 23 manufacturer update, the available dataset contains:
- Inukshuk 26/16: 7 reported nutrients, 0 guaranteed-analysis bounds, 0 unavailable.
- Eukanuba Adult Medium Breed Dry Dog Food: 7 reported nutrients, 0 guaranteed-analysis bounds, 0 unavailable.
- Purina Pro Plan Complete Essentials Chicken & Rice: 7 reported nutrients, 0 guaranteed-analysis bounds, 0 unavailable.
The initial Purina record contained five reported measurements and two unavailable measurements. The manufacturer response supplied the missing omega-3 and omega-6 values, completing the seven-nutrient comparison.
This coverage assessment helps readers understand that products with fewer reported values are not necessarily nutritionally inferior; they are less completely documented within the available dataset.
The updated coverage demonstrates how obtaining primary-source information can improve the analytical usefulness of an existing dashboard.
Nutritional Reference Comparisons
The dashboard incorporates two categories of nutritional references.
AAFCO reference values provide established nutritional context for dog-food formulation and nutritional adequacy.
Clinical nutrition reference values provide additional context for dogs with normal body condition and dogs described as inactive or obesity-prone.
These reference categories are presented separately because they serve different interpretive purposes.
A nutrient concentration falling outside a displayed reference range does not, by itself, establish that a food is unsafe or unsuitable for an individual dog.
Interpretation depends on factors including life stage, health status, energy intake, nutrient bioavailability, and the purpose of the reference.
The dashboard therefore presents reference values as analytical context rather than as an automated nutritional suitability assessment.
Energy and Pricing Comparisons
The dashboard includes metabolizable energy expressed in kilocalories per cup.
The available product values are:
- Inukshuk 26/16: 472 kcal/cup.
- Eukanuba Adult Medium Breed Dry Dog Food: 376 kcal/cup.
- Purina Pro Plan Complete Essentials Chicken & Rice: 369 kcal/cup.
The Purina value reflects the October 23, 2026 manufacturer response and replaces the previously used value of 387 kcal/cup.
The dashboard also includes product pricing as a separate comparison measure.
At the time of the original comparison, the recorded prices per pound were:
- Inukshuk 26/16: $1.84 per pound.
- Eukanuba Adult Medium Breed Dry Dog Food: $2.14 per pound.
- Purina Pro Plan Complete Essentials Chicken & Rice: $2.13 per pound.
Prices reflect the Chewy price-per-pound figures recorded for the dashboard and may change over time.
These values help readers compare energy density and product cost.
However, calories per cup and product price answer different questions. Neither measure alone establishes nutritional quality or overall feeding value.
Analytical Limitations
Several limitations affect the interpretation of the dashboard.
Source comparability: Nutritional information was obtained from different manufacturers and may reflect different reporting conventions or analytical methods.
Measurement precision: Reported nutrient concentrations and guaranteed-analysis bounds are not interchangeable.
Manufacturer-reported information: Direct manufacturer responses improve source traceability but do not constitute independent laboratory verification.
Moisture assumptions: Dry-matter conversions depend on the moisture information available for each product. Purina's calculations use its reported 8.7% moisture concentration. Other products may have different moisture reporting conventions.
Nutrient completeness: All three products now have reported values for the seven primary comparison nutrients. This does not mean that every potentially relevant nutrient has been measured or included.
Energy measurement: Calories per cup depend on manufacturer-defined serving measurements and should not be treated as a standardized cup weight across products.
Legacy supporting measurements: Some additional product information may originate from earlier source material rather than the most recent manufacturer response. Source provenance should remain distinguishable when interpreting these values.
Reference interpretation: AAFCO and clinical nutritional references are not interchangeable, and a simple comparison against a reference value does not establish individual dietary suitability.
Product pricing: Prices change over time and may differ by retailer, package size, and purchasing conditions.
Scope: The dashboard compares three selected products. Its findings should not be generalized to all dog foods or interpreted as veterinary advice.
These limitations are documented to help users distinguish what the available data supports from conclusions that would require additional evidence.
Interactive Visualization Design
Design Objectives
The Dog Food Nutrition Comparison Dashboard was designed to make nutritional information easier to compare while preserving the distinctions and limitations of the underlying data.
Three principles guided the visualization design:
Comparative clarity: Present nutritional measurements using consistent units and measurement bases.
Analytical flexibility: Allow users to explore different nutrients, nutritional reference profiles, energy density, and pricing.
Data transparency: Communicate whether values are reported measurements, guaranteed-analysis bounds, or unavailable.
The objective was not simply to rank dog foods, but to provide an interactive environment in which readers could evaluate differences and understand the evidence supporting each comparison.
Nutrient Comparison — Standardized Measurements
The primary visualization compares three dry dog foods across seven nutritional measures:
- Protein.
- Fat.
- Crude fiber.
- Calcium.
- Phosphorus.
- Omega-3 fatty acids.
- Omega-6 fatty acids.
Users can select a nutrient and compare its dry-matter concentration across the products.
Using a common dry-matter basis reduces the influence of moisture differences and makes the displayed concentrations more directly comparable.
The visualization also preserves measurement classifications so that reported values are not confused with guaranteed minimums or maximums.
Design rationale: A visually consistent chart can still communicate misleading information if the underlying measurements have different meanings. Standardization and measurement classification must therefore be part of the visualization design, not merely preprocessing steps.
Nutritional Reference Profiles — Contextual Comparison
The dashboard allows users to select among available nutritional reference profiles:
- AAFCO nutritional references.
- Clinical guidance for dogs with normal body condition.
- Clinical guidance for inactive or obesity-prone dogs.
- No reference overlay.
Reference values are displayed alongside product measurements when applicable.
This interaction allows readers to examine the same nutrient under different interpretive frameworks without changing the underlying product data.
The clinical reference values originate from Small Animal Clinical Nutrition, Chapter 13.
Design rationale: Separating nutritional measurements from reference values helps users distinguish observed product characteristics from external guidance. Allowing references to be switched also avoids presenting a single benchmark as universally applicable.
The references provide context rather than individualized veterinary recommendations.
Energy Density — Calories per Cup
The dashboard includes a calories-per-cup comparison using available metabolizable energy information.
The three products have the following reported energy values:
- Inukshuk 26/16: 472 kcal/cup.
- Eukanuba Adult Medium Breed Dry Dog Food: 376 kcal/cup.
- Purina Pro Plan Complete Essentials Chicken & Rice: 369 kcal/cup.
Purina's updated value was supplied directly by Nestlé Purina PetCare on October 23, 2026.
This comparison allows users to examine differences in energy density independently of the nutrient concentration charts.
Design rationale: Two foods with similar nutrient percentages may provide different amounts of energy per serving. Including calories per cup adds a practical dimension to the comparison that nutrient percentages alone cannot provide.
Calories per cup are manufacturer-specific serving measures and should not be interpreted as equivalent cup weights across products.
Pricing — Cost as a Separate Analytical Dimension
The dashboard provides an interactive pricing comparison alongside its nutritional and energy measures.
Pricing is treated as a separate analytical dimension rather than being combined with nutrient concentrations into a single nutritional quality score.
This separation allows users to consider cost without implying that the most expensive or least expensive product is necessarily nutritionally superior.
Design rationale: Product cost is relevant to purchasing decisions, but pricing and nutritional composition measure different characteristics. Presenting them separately avoids creating an unsupported ranking of overall product quality.
Data Coverage — Making Missing Information Visible
An important feature of the dashboard is its nutrient data coverage assessment.
For each product, the interface distinguishes:
- Reported nutritional measurements.
- Guaranteed-analysis bounds.
- Unavailable nutritional measurements.
The updated dataset includes complete reported coverage for all seven tracked nutrients for Inukshuk, Eukanuba, and Purina Pro Plan Complete Essentials.
Purina's omega-3 and omega-6 concentrations, previously unavailable in the initial dataset, were supplied in the October 23 manufacturer response.
The coverage assessment continues to distinguish between reported values and guaranteed-analysis bounds, even when all seven primary nutrients are available.
Design rationale: Missing information should not be confused with a zero concentration or evidence of inferior nutritional quality. Showing data coverage helps users assess the completeness of the comparison and understand how additional manufacturer information improves the analysis.
Supporting Data and Source Transparency
The dashboard supplements its visual comparisons with underlying nutritional values and additional manufacturer information where available.
The application distinguishes product measurements from external nutritional references and identifies limitations in the available source information.
Inukshuk and Eukanuba supplied nutritional information directly following manufacturer inquiries.
Purina initially had a less certain source record, but subsequently provided product-specific nutritional information directly on October 23, 2026.
The updated Purina data includes previously missing omega fatty acid measurements and additional information about carbohydrates, ash, and moisture.
These source distinctions are important because visualizations can otherwise create an impression of equivalent evidence quality across products.
Interactive Visualization Implementation
The dashboard uses Apache ECharts within a React component to render the selected comparison.
React state manages the active nutrient or comparison measure and the selected nutritional reference profile.
TypeScript supports consistent handling of nutrient identifiers, measurement classifications, and chart configuration.
The interface updates the displayed comparison when users select different measures or reference profiles, enabling exploration without navigating to a separate page.
The dashboard also provides supporting tabular information and nutritional data coverage summaries, allowing readers to inspect values beyond the visual presentation.
Guided Interpretation and Independent Exploration
The published inquiry combines explanatory content with interactive visualization.
Readers can use the narrative to understand the analytical questions, nutritional measurement conventions, and important limitations.
They can then explore individual nutrients, reference profiles, calories per cup, and pricing according to their own interests.
This creates two complementary experiences:
- Guided interpretation: The article explains how to interpret the data and why certain comparisons require caution.
- Independent exploration: The dashboard allows readers to investigate specific nutritional characteristics and compare the three products.
The resulting design emphasizes analytical transparency and informed exploration rather than an automated recommendation of a particular dog food.
AI-Assisted Development and Human Validation
Development Approach
The Dog Food Nutrition Comparison Dashboard was developed through an iterative, AI-assisted software development workflow.
ChatGPT supported implementation, troubleshooting, code refinement, and documentation involving Next.js, React, TypeScript, Apache ECharts, and Sanity CMS.
The development process combined AI-generated implementation guidance with human-directed analytical requirements, source research, testing, and publication decisions.
Rather than treating generated code as a finished solution, I reviewed changes incrementally, tested the resulting application, and refined the dashboard as additional nutritional information became available.
Division of Responsibilities
The project combined AI-assisted implementation with human-directed research, analytical modeling, and quality assurance.
AI-assisted activities included:
- Developing and refining TypeScript and React components.
- Supporting Apache ECharts configuration and interactive controls.
- Assisting with nutritional data structures and dry-matter conversion logic.
- Troubleshooting implementation and validation errors.
- Supporting the integration of additional nutritional measurements and reference datasets.
- Assisting with technical documentation and editorial content.
Human-directed responsibilities included:
- Defining the research questions and project objectives.
- Selecting the dog foods to compare.
- Contacting manufacturers to obtain additional nutritional information.
- Evaluating source completeness and identifying data limitations.
- Determining which nutrients and comparison measures were relevant.
- Reviewing the distinction between reported values and guaranteed-analysis bounds.
- Selecting the nutritional reference frameworks used for comparison.
- Evaluating chart usability and interpretability.
- Testing the dashboard locally and verifying production changes.
- Making final decisions about publication and how findings should be communicated.
This division of responsibilities reflects an approach in which AI accelerates implementation while analytical judgment and accountability remain with the developer.
Primary-Source Research and Validation
A significant part of the project involved obtaining nutritional information beyond standard product labeling.
I contacted Inukshuk, Eukanuba, and Purina directly to request additional nutritional data.
Inukshuk and Eukanuba responded within 24 hours of the initial inquiries, allowing their manufacturer-provided nutritional information to be incorporated into the application.
Purina had not responded as of October 20, 2026, so the initial version used nutritional values from a product-specific screenshot whose exact formula match was not independently confirmed.
On October 23, 2026, Nestlé Purina PetCare supplied nutritional information explicitly identifying Pro Plan Complete Essentials Shredded Blend Chicken & Rice.
This allowed me to update the Purina record using a direct manufacturer response, fill the missing omega fatty acid measurements, and revise the source documentation.
The research process reinforced the importance of distinguishing data acquisition, source verification, and analytical transformation as separate responsibilities.
Analytical Validation
Validation focused on whether the application represented nutritional measurements accurately and supported defensible comparisons.
The review process included:
- Checking nutritional values against available source information.
- Reviewing dry-matter conversions and measurement bases.
- Preserving minimum, maximum, and reported measurement classifications.
- Checking that unavailable measurements were not represented as zero.
- Reviewing nutritional reference values separately from product measurements.
- Verifying that calories-per-cup values corresponded to the available product information.
- Confirming that the dashboard communicated important source and methodological limitations.
- Reviewing the effects of newly supplied manufacturer measurements on nutrient coverage.
These checks were intended to reduce the risk of presenting misleading comparisons despite technically valid chart rendering.
The validation described here represents source review, analytical reasoning, and application testing. It does not constitute an independent laboratory analysis or veterinary assessment of the products.
Application Testing and Deployment
The application was developed and released incrementally.
The workflow included:
- Implementing updates in the local Next.js project.
- Running TypeScript and production-build validation.
- Testing the dashboard in the local development environment.
- Reviewing interactive controls, displayed nutritional values, and data coverage summaries.
- Committing verified changes to GitHub.
- Pushing changes to the production deployment workflow.
- Verifying the published dashboard after deployment.
The October 23 Purina update was compiled successfully using the Next.js production build process and checked in the local dashboard before preparation for deployment.
This process was repeated as manufacturer information, nutritional references, and additional comparison features were incorporated.
Testing both locally and in production is important because successful compilation alone does not establish that an analytical application displays the intended data or behaves correctly for users.
Iterative Development and Changing Requirements
The dashboard evolved as new information became available.
Early comparisons relied more heavily on limited nutritional information. Subsequent development incorporated manufacturer-supplied nutrient concentrations, additional minerals and vitamins, calories-per-cup values, and separate nutritional reference profiles.
The application was also refined to communicate the completeness of each product's available nutritional information.
Purina's October 23 response provided a practical example of updating an existing analytics product without expanding its original three-product scope or redesigning the visualization.
These changes required updates to the underlying data structures and verification that the interactive interface continued to function correctly.
The incremental development approach allowed new requirements to be incorporated while checking that existing dashboard functionality remained intact.
Lessons from AI-Assisted Development
The project reinforced several principles for applying generative AI to analytics engineering.
1. Establish analytical meaning before implementing visualizations.
A chart cannot produce a valid comparison if its measurements have inconsistent bases or different meanings.
2. Treat AI-generated implementation as work requiring verification.
Generated code can accelerate development, but compilation does not establish analytical correctness.
3. Preserve data provenance and uncertainty.
The source, measurement type, and completeness of a value can be as important as the value itself.
4. Keep human judgment central to analytical decisions.
AI can assist with implementation and documentation, but decisions about data selection, assumptions, interpretation, and publication require accountable human review.
5. Validate changes incrementally.
Small changes followed by local testing and production verification reduce the risk of introducing unnoticed errors.
6. Design for evolving evidence.
A useful analytical application should accommodate additional source information without requiring the entire visualization to be rebuilt.
The resulting development process demonstrates how AI-assisted implementation can complement established business intelligence practices, particularly when analytical rigor, source transparency, and user trust are important.
Project Outcomes and Lessons Learned
Delivered Solution
The project resulted in a publicly accessible, interactive analytics application comparing the nutritional composition, energy density, and pricing of three commercial dry dog foods.
The delivered solution includes:
- An interactive dashboard comparing seven nutritional measures across three products.
- Dry-matter normalization to support consistent nutritional comparisons.
- Explicit distinctions between reported nutrient concentrations, guaranteed-analysis bounds, and unavailable values.
- AAFCO nutritional reference values and clinical reference profiles for different canine body-condition considerations.
- Interactive comparisons of metabolizable energy expressed as calories per cup.
- Product pricing comparisons.
- Nutrient data coverage summaries that communicate the completeness of available product information.
- Additional manufacturer-supplied nutritional information, including minerals and vitamins where available.
- Updated Purina measurements obtained directly from the manufacturer on October 23, 2026.
- Documentation of data sources, analytical methodology, limitations, and AI-assisted development.
- A production Next.js application deployed through Vercel, with source control in GitHub and editorial content managed through Sanity CMS.
The dashboard was published and tested as part of the Field Notes & Data website.
Analytical Value
The project's primary analytical contribution is making nutritional information from different sources more comparable without concealing differences in measurement quality or completeness.
Dry-matter normalization provides a common basis for examining nutrient concentrations.
Measurement classifications preserve the distinction between reported concentrations and guaranteed-analysis limits.
Nutritional reference profiles provide additional context without converting the dashboard into an automated dietary recommendation system.
Energy-density and pricing comparisons extend the analysis beyond nutrient percentages, allowing readers to examine practical considerations separately.
The data coverage summaries also demonstrate that missing information should be treated as a limitation of the available evidence rather than as evidence that a product lacks a particular nutrient.
The October 23 manufacturer update further demonstrates how improved source information can increase data coverage and strengthen confidence in the underlying dataset.
Together, these features support more transparent and defensible product comparisons.
Technical Outcomes
The project demonstrates the implementation of an end-to-end interactive analytics workflow:
- Translating an everyday research question into defined analytical requirements.
- Obtaining additional source information through direct manufacturer inquiries.
- Modeling nutritional measurements using structured TypeScript data definitions.
- Applying dry-matter normalization while preserving measurement classifications.
- Separating manufacturer data from external nutritional reference datasets.
- Developing interactive React components using Apache ECharts.
- Supporting nutrient selection, reference-profile switching, pricing comparisons, and energy-density analysis.
- Communicating data completeness and source limitations within the user interface.
- Integrating an interactive analytical application with CMS-managed editorial content.
- Testing, version-controlling, deploying, and validating the application in production.
- Updating an established analytical dataset as improved manufacturer information becomes available.
The resulting portfolio project connects analytical methodology, visualization engineering, and responsible communication of incomplete data.
Technical Lessons Learned
1. Comparable measurements require more than consistent units.
Converting nutrient concentrations to a common dry-matter basis improves comparability, but the original measurement type still matters.
A guaranteed minimum, guaranteed maximum, and reported concentration can share the same unit without representing equivalent information.
2. Data acquisition is part of analytical engineering.
Direct manufacturer outreach substantially improved the available nutritional dataset.
Inukshuk and Eukanuba responded within 24 hours. Purina had not responded as of October 20, 2026, but supplied the requested information on October 23, enabling an update to the initial dataset.
This experience demonstrated how response timing and access to primary information can influence the completeness and verification status of an analytical product—and why published analyses need a process for incorporating better evidence.
3. Missing data should be visible to users.
An unavailable measurement should not be displayed as zero, estimated without justification, or silently excluded in a way that implies complete information.
Explicit data coverage indicators help users understand the limits of the comparison.
4. Reference values require careful interpretation.
AAFCO nutritional references and clinical nutrition guidance serve different purposes.
Separating reference profiles from product measurements allows users to explore different contexts without presenting any single reference as a universal determination of dietary suitability.
5. Interactive visualization benefits from a clear analytical model.
The usefulness of an interactive chart depends on the consistency of the data structures and calculations behind it.
Separating product measurements, normalization logic, and reference datasets makes the application easier to maintain as new information becomes available.
6. AI-assisted development requires human validation.
AI support accelerated implementation, troubleshooting, and documentation.
However, source selection, analytical assumptions, nutritional interpretation, testing, and publication decisions remained human-directed responsibilities.
7. Incremental delivery supports reliability.
Introducing changes in small, testable steps made it possible to incorporate new manufacturer information and dashboard features while checking that existing functionality continued to work.
Local testing, TypeScript validation, Git version control, and production verification were all part of the delivery process.
8. Data quality improvement continues after publication.
The initial dashboard was useful even though some manufacturer information was incomplete.
Purina's subsequent response provided better evidence, allowing the dataset and its documentation to be improved without abandoning the original analytical framework.
This illustrates why analytical products should be designed for ongoing maintenance rather than treated as permanently finished once published.
Professional Application
This project demonstrates how established business intelligence and data visualization practices can be applied to a modern, interactive web application.
The most relevant transferable capabilities include:
- Analytical requirements definition and problem framing.
- Primary-source research and data acquisition.
- Data normalization, modeling, and quality assessment.
- Interactive visualization design and development.
- Communicating incomplete information and analytical limitations.
- AI-assisted software development with human validation.
- Technical documentation and iterative production delivery.
- Maintaining analytical products as new evidence becomes available.
Although this is an independently developed portfolio application rather than a commissioned enterprise implementation, its development process reflects many of the same considerations involved in professional analytics delivery: clear requirements, defensible calculations, transparent assumptions, maintainable components, and reliable deployment.
The project also demonstrates how AI-assisted development can extend a business intelligence practitioner's ability to build and deliver interactive analytical applications beyond traditional BI platforms.
Explore the Published Inquiry
The companion inquiry presents the nutritional comparison and interactive dashboard.
Dog Food Nutrition Comparison
https://fieldnotesanddata.com/inquiries/dry-dog-food-nutrition-comparison
AI WORKFLOW
How AI supported development.
ChatGPT was used as an AI-assisted development partner to help structure the analytical approach, develop and refine Next.js, React, TypeScript, and Apache ECharts components, troubleshoot implementation issues, and draft technical documentation. AI-generated suggestions and code were reviewed through human-directed validation, local testing, and production verification. Product selection, manufacturer outreach, source evaluation, analytical decisions, and final approval remained human-led.
HUMAN REVIEW
Analytical judgment and validation.
I identified the analytical problem after observing frequent endorsements of certain dog-food brands by upland hunting influencers. I selected the three products, contacted their manufacturers for nutritional information, evaluated source reliability, and determined how to handle missing or unverified data. I directed the dashboard's analytical design, selected appropriate nutritional reference frameworks, reviewed AI-assisted implementation, and validated the resulting visualizations. Final decisions about methodology, transparency, interpretation, and publication remained my responsibility.
REPRODUCIBILITY
Data sources and limitations.
Inukshuk 26/16 — Manufacturer Nutritional Data — Nutritional information obtained directly from the manufacturer via email. The manufacturer responded within 24 hours. Data includes seven reported nutrients and an energy density of 472 kcal/cup. Nutritional values were incorporated into the dashboard's standardized comparison.
Eukanuba Adult Medium Breed Dry Dog Food — Manufacturer Nutritional Data — Nutritional information obtained directly from the manufacturer via email. The manufacturer responded within 24 hours. Data includes seven reported nutrients and an energy density of 376 kcal/cup. Nutritional values were incorporated into the dashboard's standardized comparison.
Purina Pro Plan Complete Essentials Chicken & Rice — Nutritional Data — Nutritional information obtained from a screenshot believed to correspond to Purina Pro Plan Complete Essentials Chicken & Rice. The exact product match has not been independently verified. The data includes five reported nutrients and an energy density of 387 kcal/cup; omega-3 and omega-6 values were unavailable. Purina had not responded to the manufacturer's data inquiry as of October 20, 2026. These limitations are disclosed in the dashboard and case study.
AAFCO — Dog Food Nutrient Profiles — AAFCO Dog Food Nutrient Profiles provide nutritional reference values for evaluating nutrient adequacy by life stage. Relevant values were used as reference benchmarks in the dashboard, not as product-specific measurements or proof that any individual food is appropriate for a particular dog.
Small Animal Clinical Nutrition — Chapter 13 — Published veterinary clinical nutrition reference. Chapter 13 was used to contextualize nutritional considerations for dogs in normal body condition versus inactive or obesity-prone dogs. These clinical references provide comparative context rather than product-specific measurements, individual feeding prescriptions, or veterinary recommendations.
Commercial Dog Food — Retail Pricing Data — Retail pricing information for the three selected dog foods was incorporated into the dashboard to provide cost context alongside nutritional comparisons. Prices are time-sensitive and may vary by retailer, package size, location, and promotional availability. Pricing should not be interpreted as a fixed manufacturer price.
The comparison includes only three dog foods selected because of their visibility in upland hunting social media, not through systematic market sampling. Manufacturer nutritional reporting varies in completeness and measurement conventions, and guaranteed-analysis values represent minimum or maximum bounds rather than exact measured concentrations. Dry-matter conversions based on declared moisture limits are estimates. Purina's nutritional data came from a screenshot whose exact product match has not been independently confirmed; Purina had not responded to the information request as of October 20, 2026. Omega-3 and omega-6 values were unavailable for Purina. Retail prices may change over time. AAFCO and clinical nutrition references provide context but do not establish which food is best for an individual dog. The dashboard does not evaluate digestibility, ingredient quality, feeding trials, or real-world hunting performance and is not a substitute for veterinary nutritional advice.